Hotel occupancy in Brussels declined following the 2016 terrorist attacks, but has now seen steady growth for more than 5 straight months. According to STR, the rise in occupancy levels can be attributed to a 40.4% increase in group business year over year when comparing March 2016 to March 2017. Knowland provided insight into the specific segments and subsets driving that group business to the Brussels market to further address what types of organizations were the most significant contributors to the rising occupancy levels.

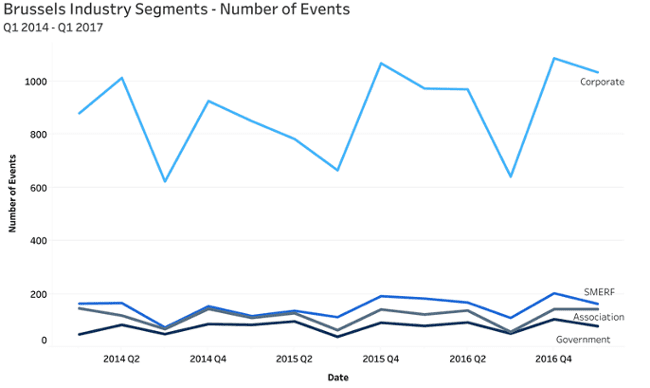
Corporate organizations account for an overwhelming majority of group business is Brussels, sourcing 73% of actualized meetings to the market from 2014 through 2016. The deep decline in meetings in Q3 2016 corresponds with the market-wide drop in occupancy. Group performance in that timeframe, however, is not entirely dissimilar from other years in which Q3 generally performs weaker than other quarters. Overall, group business shows a clear rise at the end of 2016 into 2017.

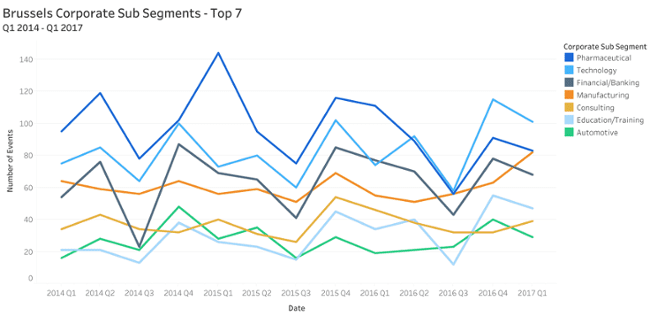
Within the corporate market segment, the top sub-segments with the greatest number of total events actualized are:
- Pharmaceutical
- Technology
- Financial/banking
- Manufacturing
- Consulting
- Education/training
- Automotive
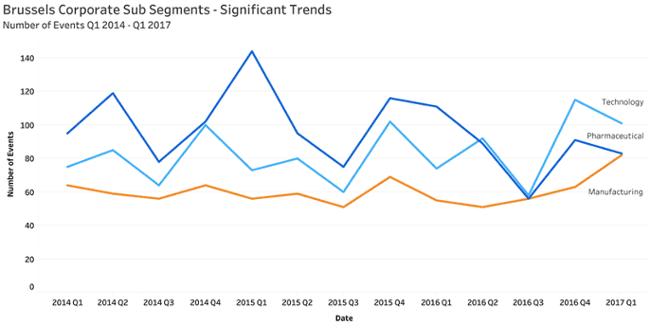
Though pharmaceutical meetings dominated the majority of the period between Q1 2014 and Q1 2017, including a surge of events at the end of 2014, pharma meetings are declining year over year. Other corporate sub-segments showing stronger trends in recent months include manufacturing and technology.

Technology groups have become the top driver of meetings and events in Brussels and have dominated over pharmaceutical group meetings for 4 consecutive quarters since the beginning in Q2 2016. By the end of Q1 2017, pharmaceutical meetings nearly lost to manufacturing in terms of total number of events. The manufacturing sub segment has shown a strong upswing of positive growth for the past 4 quarters.

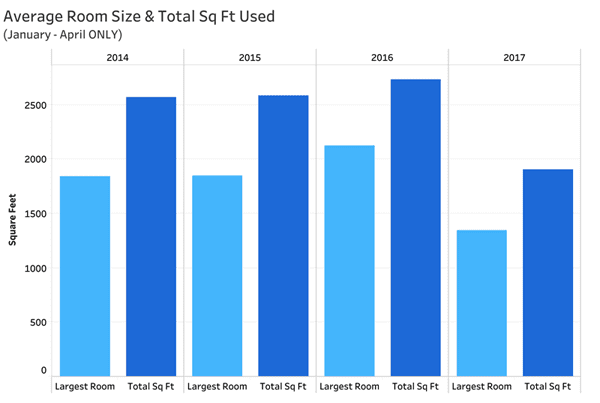
Compared previous years, the average room size used for group meetings in Brussels dropped significantly in Q1 2017. Both largest room size and total number of square footage used increased gradually year over year from Q1 2014 to Q1 2016, with total square footage used for a meeting climbing to an average of nearly 2,800 square feet. While the average largest room used in Q1 2016 was more than 2,100 square feet, in 2017 that number fell below 1,400 square feet for groups meeting in the Brussels market.
As local competitors increase, successful hotels need to be more strategic about how they fill their rooms. Staying ahead of other properties vying for group business requires knowing where to look for unique opportunities and what groups are generating the most opportunity. Big data can lend a big hand.
About Knowland
Knowland provides group data and innovative technology to help hotels, CVBs, and other venues drive revenue with meetings market intelligence. Knowland offers extensive insight into market analytics, industry trends, and powerful benchmarking for booking better-qualified group business. Acting on behalf of the hospitality industry as a whole, as well as its customers, Knowland continually strives to increase transparency of the group market and deliver best-in-class meetings and events sales solutions.
![]()
