Each month, Knowland collects a significant amount of data on forward-looking group demand across 60+ major North American markets. This data is provided by CVBs that participate in Knowland’s TAP Report. It is unique in providing group room nights booking pace information across the entire multi-year future booking window, representing over 30 million annual room nights and nearly 50% of the group business conducted by hotels across these markets.
By freely sharing some of this data in an aggregated form, we believe we can help our community anticipate what lies ahead and enable you to manage your business accordingly. We encourage you to share this new resource, the Pace Navigator, with your peers!
Sign up now to get the Pace Navigator in your Inbox ›
On the Books Pace & New Bookings Velocity,
as of June 30, 2018:

| On the Books (OTB) Pace: +4.2% |
 |
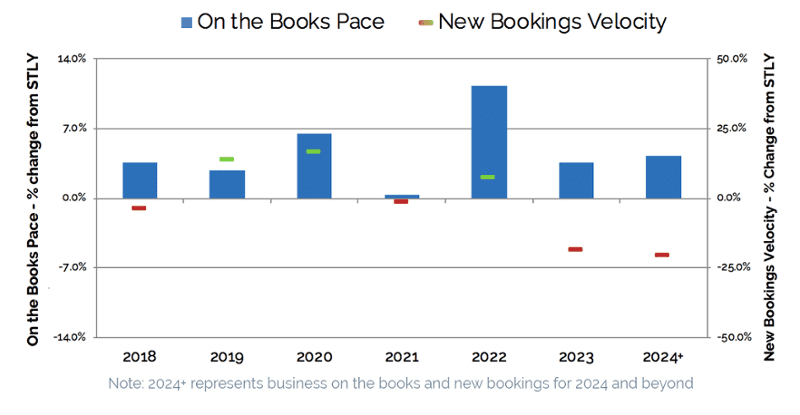
This metric measures the change in definite room nights on the books, as of June 30, 2018, compared to the what was on the books the same time last year (STLY), or June 30, 2017. Across all future dates, our data indicates 4.2% more definite rooms are on the books, compared to this time in 2017. The graph above shows the OTB Pace change versus same time last year, for each year in the future booking horizon.
| New Bookings Velocity: -1.4% |
 |
This metric measures the change in room nights from newly signed bookings over the last three months, in this case April – June, compared to room nights booked over the same time last year (STLY). Across all future dates, the new bookings velocity is down 1.4% compared to the same 3-month window in 2017. The graph above shows the new bookings velocity change versus same time last year, for each year in the future booking horizon. For example, the +14% new bookings velocity for 2019 compares the total room nights from April – June 2018 new bookings for 2019 to the total room nights from April – June 2017 new bookings for 2018.
Our Take on This Month’s Data:
With the number of room nights on the books for all future dates (2018 to 2024 and beyond) up 4.2% versus the same time last year, overall group demand across North America is in a strong position. That said, the velocity of room nights coming onto the books from new bookings over the last three months is actually slightly down compared to the same period last year. A continued shortfall in the pace of new bookings could potentially erode that strong on-the-books position. We will be watching this closely in the coming months.
There is more business on the books for every year in the future horizon, though only very slightly so in 2021. Meanwhile, 2020 and 2022 are looking the strongest versus this time last year, with more business on the books and a higher velocity of new bookings.
While 2023 and beyond also look strong based on business on the books, new bookings velocity for those years are significantly below (-20%) the pace of new room nights added for those years over the same three-month period last year. If the new bookings pace shortfall continues, the picture will change quickly.
2018 is holding strong, although new bookings velocity is slightly lower compared to the same time last year. Given the short booking window remaining in 2018, and the limited number of in-the-year-for-the-year group bookings delivered by CVBs, this is not likely a cause for concern.
We hope you find this data useful! We’d love to hear your feedback. Don’t forget to sign up now to get the Pace Navigator delivered to your Inbox each month ›
Enjoy!
Tim Hart, CEO of Knowland
![]()
