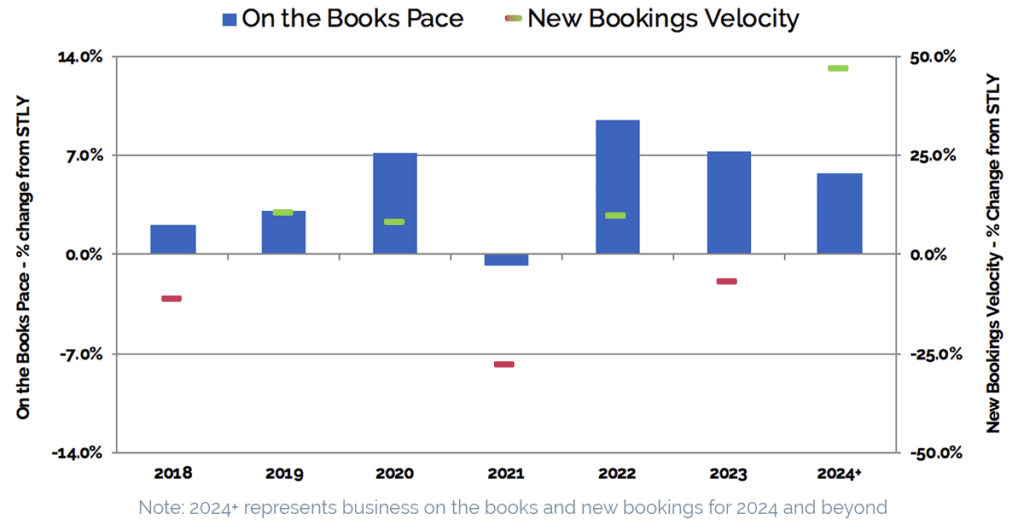
Our latest analysis of group demand pace and new bookings velocity has arrived! As we saw last month, advance group demand remains strong in North America… with the biggest news on the new bookings velocity front, which almost doubled month-over-month, going from 3.3% to 6.4% in aggregate! Most of this impressive uptick can be seen in bookings for arrival dates 5+ years from now. Check out the full results below.
Sign up now to get the Pace Navigator in your Inbox ›
On the Books Pace & New Bookings Velocity,
as of September 30, 2018:

| On the Books (OTB) Pace: +4.2% |
 |
This metric measures the change in definite room nights on the books, as of September 30, 2018, compared to what was on the books the same time last year (STLY), or September 30, 2017. Holding steady since last month, our data indicates 4.2% more definite rooms are on the books, compared to this time in 2017. The graph above shows the OTB Pace change versus same time last year, for each year in the future booking horizon.
| New Bookings Velocity: +6.4% |
 |
This metric measures the change in room nights from newly signed bookings over the last three months, in this case July – September, compared to room nights booked over the same time last year (STLY). Across all future dates, the new bookings velocity is up 6.4% compared to the same 3-month window in 2017. The graph above shows the new bookings velocity change versus same time last year, for each year in the future booking horizon. For example, the +10.6% new bookings velocity for 2019 compares the total room nights from July – September 2018 new bookings for 2019 to the total room nights from July – September 2017 new bookings for 2018.
Our Take on This Month’s Data:
While recent industry reporting shows overall North American occupancy and RevPAR growth positive but decelerating and 2019 expectations moderating, advance group demand nevertheless remains strong. The number of room nights on the books for all future dates continues to be up versus this time last year, with 2021 as the exception. We don’t see a great deal of difference directionally in these numbers month-over-month.
The biggest news is on the new bookings velocity front, which almost doubled month-over-month, going from 3.3% to 6.4% in aggregate! Most of this impressive uptick can be seen in bookings for arrival dates 5+ years from now. That said, we do see a slow down in velocity for several years when comparing to the data we shared last month, including 2018 (from +3.9% last month to -11.5% this month) and 2023 (from +45.9% to -6.8% this month). Booking velocity can be quite volatile month-over-month, but we will nevertheless be keeping a close eye on these years.
Additionally, 2021 has been lagging in both OTB pace and new bookings velocity, and that trend continues month-over-month. As we mentioned in the last Pace Navigator, savvy sales teams will want to monitor these trends in the coming months, as new bookings velocity for 2021 continues to be down by almost 28% compared to the same time last year and OTB pace lags by almost a percentage point.
What do you think? We’d love to hear your thoughts!
About the Pace Navigator:
Each month, Knowland collects a significant amount of data on forward-looking group demand across 60+ major North American markets. This data is provided by Convention and Visitor Bureaus (CVBs) that participate in Knowland’s TAP Report. It is unique in providing group room nights booking pace information across the entire multi-year future booking window. This data represents over 30 million annual room nights, and represents nearly 50% of the group business conducted by hotels across these markets.
Sign up now to get the Pace Navigator in your Inbox ›
![]()
