Our latest analysis of group demand pace and new bookings is here! 2019 is off to a good start across major North American markets, with group room nights on the books up over last year. We also get our first stand-alone look at 2024, which promises to be strong. Check out of the results in this month’s Pace Navigator!
Sign up now to get the Pace Navigator in your Inbox ›
On the Books Pace & New Bookings Velocity, as of January 31, 2018

| On the Books (OTB) Pace: +5.4% |
 |
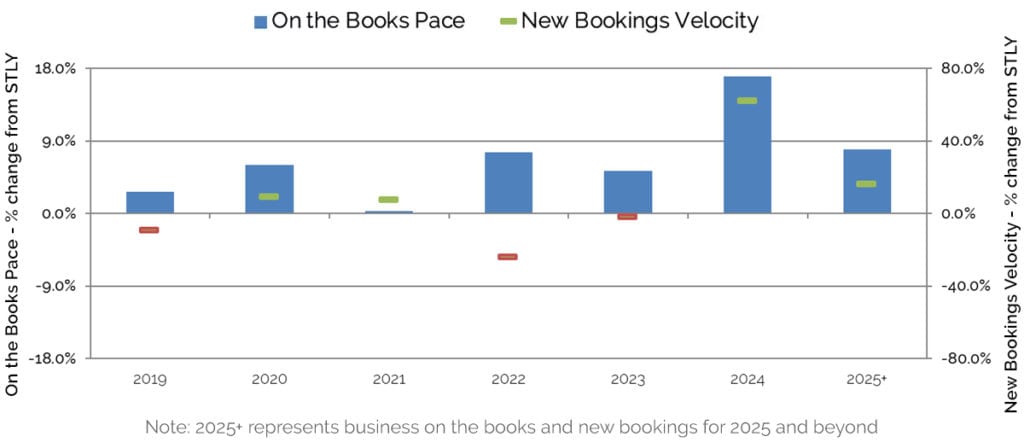
This metric measures the change in definite room nights on the books, as of January 31, 2019, compared to what was on the books the same time last year (STLY), or January 31, 2018. Holding steady since last month, our data indicates 5.4% more definite rooms are on the books, compared to this time in 2018. The graph above shows the OTB Pace change versus same time last year, for each year in the future booking horizon.
| New Bookings Velocity: +4.2% |
 |
This metric measures the change in room nights from newly signed bookings over the last three months, in this case November – January, compared to room nights booked over the same time last year (STLY). Across all future dates, the new bookings velocity is up 4.2% compared to the same 3-month window in 2017/2018. The graph above shows the new bookings velocity change versus same time last year, for each year in the future booking horizon. For example, the +7.7% new bookings velocity for 2021 compares the total room nights from November 2018 – January 2019 new bookings for 2 years into the future to the total room nights from November 2017 – January 2018 new bookings for 2 years into the future.
Our Take on This Month’s Data:
2019 is off to a good start across major North American markets. Group room nights on the books are up 5.4% over the same time last year. This improvement is driven by strong new booking velocity, with 4.2% more new room nights added over the last three months versus the same period last year. New bookings velocity for 2019 on its own, however, was slightly down versus last year. Despite this slower velocity, we are still sitting ahead by 2.7% in on the books pace for 2019.
This is the first month we get a stand-alone look at 2024. We are currently seeing high pace and booking velocity numbers for 2024. Because 2024 is 5 years into the future, some volatility can be expected at this early stage in the booking window. But it is reassuring to see such strong early booking performance from the CVB community.
2021 remains an exception to the generally strong position of demand across the future years. Recent new booking velocity has kept 2021 just barely over the on the books pace position versus same time last year. As we get further into the booking window, CVBs will play a less dominant role in new bookings, and hotels will take over. Relative to other years, they will play a bigger role in driving demand for 2021.
At the recent Hunter Hotel Conference held in Atlanta, the sentiment of industry analysts, hotel operators and hotel owners was positive. There was consensus that demand growth will continue through 2019 and 2020. Supply growth will slightly exceed demand growth, but it too is slowing and is below its long term average growth. While there are challenges, such as tepid ADR growth, a severe labor shortage, and rising labor costs, the demand outlook remains solid.
So based on what we know, and on what others seem to expect, there is reason to believe that this industry growth cycle still has gas in the tank. Of course, unforeseen events can change that outlook. So we will continue to track this all-important future demand pace, since it is from there that some of the earliest indication of change will come.
About the Pace Navigator:
Each month, Knowland collects a significant amount of data on forward-looking group demand across 60+ major North American markets. This data is provided by Convention and Visitor Bureaus (CVBs) that participate in Knowland’s TAP Report. It is unique in providing group room nights booking pace information across the entire multi-year future booking window. This data represents over 30 million annual room nights, and represents nearly 50% of the group business conducted by hotels across these markets.
Sign up now to get the Pace Navigator in your Inbox ›
![]()
