Knowland is the only source for Convention & Visitors Bureaus (CVBs) performance and booking demand forecasting. The monthly Pace Navigator aggregates, analyzes, and reports on past and future event booking data as reported by participating CVBs, to deliver actionable trending insights needed to make better strategic decisions. Leveraging publicly available information from our TAP and Knowland data sets will give you insight into this valuable booking channel that accounts for over 50% of metropolitan area bookings for hotels.
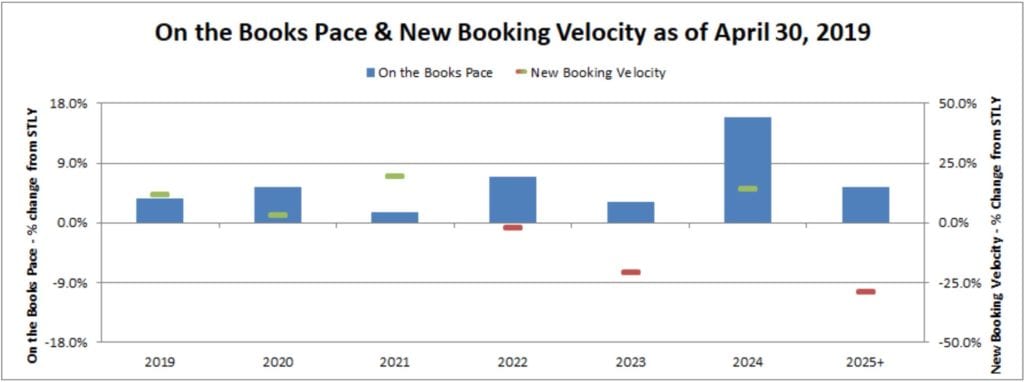
North American group demand remains ahead of pace versus the same time last year. Overall On the Books (OTB) Pace is up 5.0%, a 0.4% improvement from last month. New Booking Velocity has been trending down the past few months. It remains slightly down (-0.3%) this month, which although still negative, is an improvement over the prior two months, when it was down by around 7%.
For a deeper dive into the Knowland Pace Navigator, be sure to follow the Knowland Quarterly Market Outlook which looks at three months of data, scheduled for release later in July.
Sign up now to get the Pace Navigator and Quarterly Market Outlook in your Inbox ›
Check out the results in this month’s Pace Navigator!

| On the Books (OTB) Pace: +5.0% |
 |
This metric measures the change in definite room nights on the books, as of April 30, 2019, compared to what was on the books the same time last year (STLY), or April 30, 2018. Our data shows that we have 5.0% more room nights on the books compared to this time in 2018, up 0.4% from where we sat one month ago. The graph above shows the OTB Pace change versus the same time last year, for each year in the future booking horizon.
| New Bookings Velocity: -0.3% |
 |
This metric measures the change in room nights from newly signed bookings over the last three months, in this case, February – April, compared to room nights booked over the same time last year (STLY). Across all future dates, the new bookings velocity is down 0.3% compared to the same 3-month window in 2017/2018. The graph above shows the new bookings velocity change versus the same time last year, for each year in the future booking horizon. For example, the +7.7% new bookings velocity for 2021 compares the total room nights from November 2018 – January 2019 new bookings for 2 years into the future to the total room nights from November 2017 – January 2018 new bookings for 2 years into the future.
Our Take on This Month’s Data:
Knowland data showing lower Booking Velocity correlates with CVENT’s recently published findings, which also show the 12 month moving average for Q1 bookings for 2019 is trending down.
The data also shows that demand for each year in the future is growing and this includes 2021, which has for much of the last several months been lagging in year-over-year demand pace. In fact, 2021 is up 0.8% from last month and now sits 1.6% ahead in pace.
So far the weaker recent booking velocity has not eroded the overall On the Books position, which indicates that the group segment demand outlook remains strong. However, continued weakness in New Booking velocity will lead to greater uncertainty around expected group segment growth in the coming years.
About the Pace Navigator:
Each month, Knowland collects a significant amount of data on forward-looking group demand across 60+ major North American markets. This data is provided by Convention and Visitor Bureaus (CVBs) that participate in Knowland’s TAP Report. It is unique in providing group room nights booking pace information across the entire multi-year future booking window. This data represents over 30 million annual room nights and represents nearly 50% of the group business conducted by hotels across these markets.
Sign up now to get the Pace Navigator and Quarterly Market Outlook in your Inbox ›
![]()
