The monthly Pace Navigator gives you the Knowland Advantage! Through its TAP solutions, Knowland aggregates, analyzes, and reports on past and future event booking data as reported by participating CVBs, to deliver actionable trending insights needed to make better strategic decisions.
2021 continues to be a focal point. Pacing just ahead of the same time last year (STLY), the year is entering the peak booking window (one year). This means there should be upside on this performance over the next twelve months. Digging further into the data, the months with the biggest opportunities are March and May, which are pacing down 10.6% and 22.1% to STLY respectively.
Sign up now to get the Pace Navigator and Quarterly Market Outlook in your Inbox ›
Check out the results in this month’s Pace Navigator!

| On the Books (OTB) Pace: +4.5% |
 |
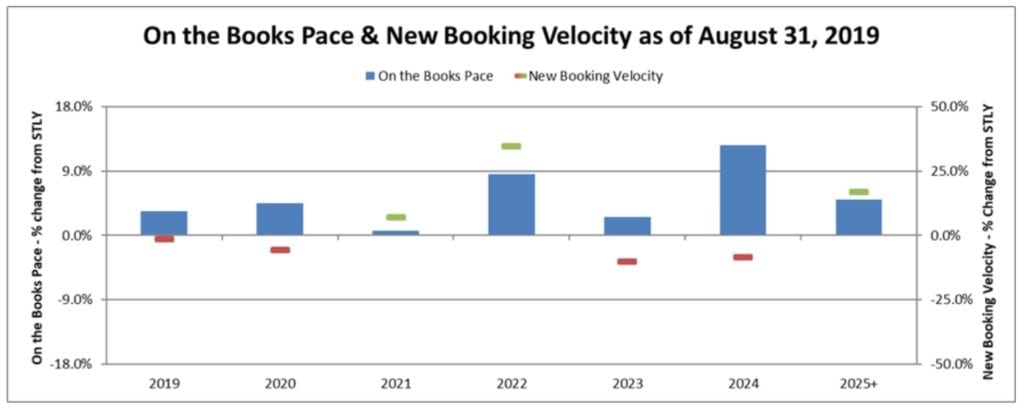
This metric measures the change in definite room nights on the books, as of August 31, 2019, compared to what was on the books the same time last year (STLY), or August 31, 2018. Our data shows there are 4.5% more room nights on the books compared to this time in 2018. The graph above shows the OTB Pace change versus the same time last year, for each year in the future booking horizon.
| New Bookings Velocity: +4.4% |
 |
This metric measures the change in room nights from newly signed bookings over the last three months, in this case, June – August, compared to room nights booked over the same time last year (STLY). Across all future dates, the new bookings velocity is up 4.4% compared to the same 3-month window in 2018. The graph above shows the new bookings velocity change versus the same time last year, for each year in the future booking horizon. For example, the +7.1% new bookings velocity for 2021 compares the total room nights from June 2019 – August 2019 new bookings for 2 years into the future to the total room nights from June 2018 – August 2018 new bookings for 2 years into the future.
Our Take on This Month’s Data:
At the end of August, CVB demand is pacing ahead of the same time last year by 4.5% and Velocity sits up 4.4% to the same time last year. While both metrics are slightly down compared to last month, the change is insignificant.
The second-lowest pacing year is 2023. While 2023 is in a good position at 2.6% ahead of the same time last year, there are still a few holes to fill in as we take a closer look. The notable months are March, August, and December down 14.5%, 16.8%, and 14.2% respectively to the same time last year. As we enter the beginning of the CVB booking window bell curve for 2023, Knowland expects some of these gaps to be filled, and the positioning of the whole year to improve.
About the Pace Navigator:
Each month, Knowland collects a significant amount of data on forward-looking group demand across 60+ major North American markets. This data is provided by Convention and Visitor Bureaus (CVBs) that participate in Knowland’s TAP Report. It is unique in providing group room nights booking pace information across the entire multi-year future booking window. This data represents over 30 million annual room nights and represents nearly 50% of the group business conducted by hotels across these markets.
Sign up now to get the Pace Navigator and Quarterly Market Outlook in your Inbox ›
![]()
