The monthly Pace Navigator gives you the Knowland Advantage! Through its TAP solutions, Knowland aggregates, analyzes, and reports on past and future event booking data as reported by participating CVBs, to deliver actionable trending insights needed to make better strategic decisions.
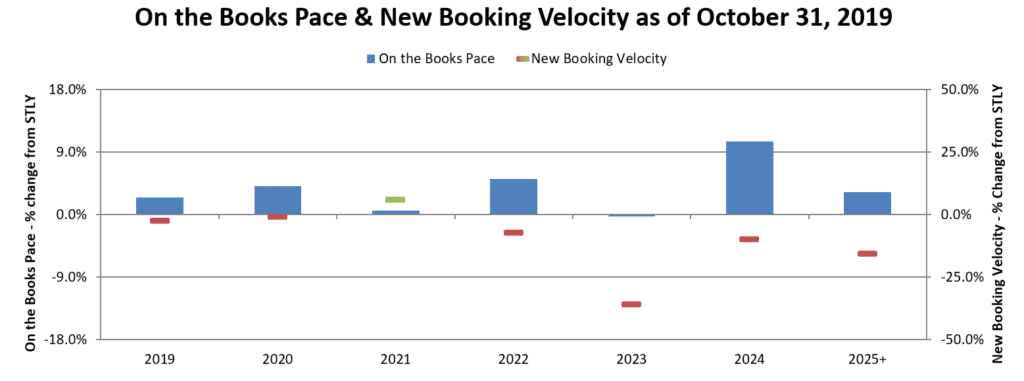
For the first time in five months, we are seeing 2023 behind in both Pace at -0.3% and Booking Velocity at -36.2%. A closer examination reveals, Q1 and Q3 as the primary cause for these declines (behind 6% and 7% respectively). Since we are at the very early stages of the booking curve for 2023, we expect the positioning will improve as we continue through the booking cycle.
Sign up now to get the Pace Navigator and Quarterly Market Outlook in your Inbox ›
Check out the results in this month’s Pace Navigator!

| On the Books (OTB) Pace: +3.2% |
 |
This metric measures the change in definite room nights on the books, as of October 31, 2019, compared to what was on the books the same time last year (STLY), or October 31, 2018. Our data shows that we have 3.2% more room nights on the books compared to this time in 2018. The graph above shows the OTB Pace change versus the same time last year, for each year in the future booking horizon.
| New Bookings Velocity: -8.9% |
 |
This metric measures the change in room nights from newly signed bookings over the last three months, in this case, August – October, compared to room nights booked over the same time last year (STLY). Across all future dates, the new bookings velocity is down 8.9% compared to the same 3-month window in 2018. The graph above shows the new bookings velocity change versus the same time last year, for each year in the future booking horizon. For example, the +5.7% new bookings velocity for 2021 compares the total room nights from August 2019 – October 2019 new bookings for 2 years into the future to the total room nights from August 2018 – October 2018 new bookings for 2 years into the future.
Our Take on This Month’s Data:
Despite a slowdown in booking velocity, the demand for CVB sourced business across North America sits ahead of the same time last year by 3.2%. This pace continues the downward trend we have seen over the past 5 months. We will continue to monitor this to see if the trend continues as we come towards the end of the year.
About the Pace Navigator:
Each month, Knowland collects a significant amount of data on forward-looking group demand across 60+ major North American markets. This data is provided by Convention and Visitor Bureaus (CVBs) that participate in Knowland’s TAP Report. It is unique in providing group room nights booking pace information across the entire multi-year future booking window. This data represents over 30 million annual room nights and represents nearly 50% of the group business conducted by hotels across these markets
Sign up now to get the Pace Navigator and Quarterly Market Outlook in your Inbox ›
